-
March
-
Luxor hot air balloon crash
-
Education in the United States
-
Roberto Benigni
-
Lawsuit
-
Argo
-
World Giving Index
-
British Royal Family
-
Babysitting
-
Italian general election 2013
-
Spell checker
-
Slavery
-
Raphael
-
Franklin D. Roosevelt
-
Google Books
-
Economy of the United States
-
Judy Dench
-
Counterfeit
-
Bilderberg Group
-
Telecom Italia
-
Ancestry.com
-
Peer Steinbrück
-
Generic drug
-
Fakelore
-
Nokia Lumia 920
-
Speech synthesis
-
2013 Sequestration
-
Grana Padano
-
Birdwatching
-
Google driverless car
-
Human anatomy
|
WIKIMAG n. 4 - Marzo 2013
Economy of the United
States
Text is available under the
Creative Commons Attribution-ShareAlike License; additional
terms may apply. See
Terms of
Use for details.
Wikipedia® is a registered trademark of the
Wikimedia Foundation,
Inc., a non-profit organization.
Traduzione
interattiva on/off
- Togli il segno di spunta per disattivarla

|
Economy of the United States of
America |

New York City, financial center of the United
States |
| Rank |
1st (nominal) /
1st (PPP) |
| Currency |
US$ (USD) |
|
Fiscal year |
October 1 – September 30 |
|
Statistics |
|
GDP |
$15.676 trillion (2012)
[1][2] |
| GDP growth |
2.3% (2012)[3] |
| GDP per capita |
$49,601 (2012)[2]
(14th–2011,
nominal;
6th–2011, PPP) |
| GDP by sector |
agriculture: 1.2%, industry: 19.2%, services:
79.6% (2011 est.) |
|
Inflation (CPI) |
1.6% (January 2012-January 2013)
[4] |
Population
below
poverty line |
15.0% (2011)[5] |
|
Gini coefficient |
0.477 (2011) (List
of countries)[6] |
| Labor force |
155.654 million (includes 12.332 mil.
unemployed, January 2013)[7] |
Labor force
by occupation |
farming, forestry, and fishing: 0.7%
manufacturing, extraction, transportation, and crafts: 20.3%
managerial, professional, and technical: 37.3% sales and office:
24.2% other services: 17.6% (2009) [note: figures exclude the
unemployed] |
| Unemployment |
7.9% (January 2013)[7]
 (+0.1%)
 |
| Average gross salary |
$45,230 (May 2011)[8] |
| Main industries |
Highly diversified, world leading,
high-technology innovator, second largest industrial output in
world; petroleum,
steel,
motor vehicles,
aerospace,
telecommunications, chemicals,
electronics,
food processing, consumer goods, lumber, mining |
|
Ease of Doing Business Rank |
4th
[9] |
|
External |
| Exports |
$1.564 trillion (2012)[10] |
| Export goods |
capital goods, 27.9%; industrial supplies and
materials (except oil fuels), 24.8%; consumer goods (except
automotive), 11.8%; automotive vehicles and components, 9.4%;
food, feed, and beverages, 8.6%; fuel oil and petroleum
products, 7.6%; aircraft and components, 6.1%; other, 3.8%. |
| Main export partners |
Canada 18.9%; Mexico 14.0%; China, 7.1%; Japan,
4.5%; United Kingdom, 3.5% (2012) |
| Imports |
$2.299 trillion (2012)[10] |
| Import goods |
Consumer goods (except automotive), 22.7%;
capital goods (except computing), 18.7; industrial supplies
(except crude oil), 18.4%; crude oil, 13.7%; automotive vehicles
and components, 13.1%; computers and accesories, 5.4%; food,
feed, and beverages, 4.8%; other, 3.1%. |
| Main import partners |
China, 18.7%; Canada, 14.2%; Mexico, 12.2%;
Japan, 6.4%; Germany, 4.8% (2012) |
|
FDI stock |
$227.9 billion (2011)[11] |
| Gross external debt |
$14.71 trillion / 98% of GDP (as of June 2011)[12] |
|
Public finances |
|
Public debt |
$16.588 trillion[13]
/ 107.18% of GDP[14] |
|
Budget deficit |
$1.09 trillion (2012)[15] |
| Revenues |
$2.45 trillion (individual income tax, 46.1%;
social insurance, 34.7%; corporate taxes, 9.9%; other, 9.3% -
2012)[15] |
| Expenses |
$3.54 trillion (Social Security, 21.5%; defense,
18.4%; Medicare, 13.2%; interest, 7.3%; Medicaid, 7.1%; other,
32.4% - 2012)[15] |
| Economic aid |
ODA $19 billion, 0.2% of GDP (2004)[16] |
|
Credit rating |
|
| Foreign reserves |
$151.866 billion (Dec. 2012)
[20] |
Main data source: CIA World Fact Book
All values, unless otherwise stated, are in
US dollars |
The economy of the United States is the world's largest
national economy and the world's second largest overall economy, the GDP
of the
EU being approximately $2 trillion larger. Its nominal GDP was
estimated to be $15.7 trillion in 2012 ,[1]
approximately a quarter of
nominal global GDP.[2]
Its GDP at
purchasing power parity is the largest in the world, approximately a
fifth of
global GDP at purchasing power parity.[2]
The U.S. is one of the world's wealthiest nations, with abundant
natural resources, a well-developed infrastructure, and high
productivity.[22]
It has the world's sixth-highest
per capita GDP (PPP).[2]
The U.S. is the world's
third-largest producer of oil and
second-largest producer of natural gas. It is the second-largest
trading nation in the world behind
China[23].
Its five
largest trading partners are :
European Union,
Canada,
China,
Mexico
and Japan.
The United States has a
mixed economy[24][25]
and has maintained a stable overall GDP growth rate, a moderate
unemployment rate, and high levels of research and
capital investment. It has been the world's largest national economy
(not including colonial empires) since at least the
1890s.[26]
As of 2010, the country remains the world's largest manufacturer,
representing a fifth of the global manufacturing output.[27]
Of the world's 500 largest companies, 132 are headquartered in the
United States. This is twice the total of any other country.[28]
The labor market in the United States has attracted
immigrants from all over the world and its
net migration rate is among the highest in the world. The U.S. is
one of the top-performing economies in studies such as the
Ease of Doing Business Index, the
Global Competitiveness Report,[29]
and others. The United States is ranked first globally in the
IT industry competitiveness index.[30]
About 60% of the global currency reserves have been invested in the
United States dollar, while 24% have been invested in the euro. The
country is one of the world's largest and most influential
financial markets. The
New York Stock Exchange (formally known as
NYSE Euronext) is the world's largest stock exchange by
market capitalization.[31]
Foreign investments made in the United States total almost
$2.4 trillion, which is more than twice that of any other country.[32]
American
investments in foreign countries total over $3.3 trillion, which is
almost twice that of any other country.[33]
Total public and private debt was $50.2 trillion at the end of the
first quarter of 2010, or 3.5 times GDP.[34]
In October 2012, the proportion of
public debt was about 1.0043 times the GDP.[35]
Domestic financial
assets
totaled $131 trillion and domestic financial
liabilities totaled $106 trillion.[36]
The US economy is orderly reviewed with comprehensive
economic data analysis by the
Beige Book[37]
of the
Federal Reserve System,[38]
the
Bureau of Economic Analysis of the
Department of Commerce,[39][40]
the
Bureau of Labor Statistics[41]
of the
United States Department of Labor and
economic indicators[42]
of the
United States Census.
The United States' economy is currently embroiled in the economic
downturn which followed the
Financial crisis of 2007–2008, with output still below potential
according to the
CBO[43]
and unemployment still above historic trends[44]
as of late 2012.
History
The economic history of the United States has its roots in European
settlements in the 16th, 17th, and 18th centuries. The American colonies
went from marginally successful colonial economies to a small,
independent farming economy, which in 1776 became the United States of
America. In 180 years the United States grew to a huge, integrated,
industrialized economy that still makes up over a quarter of the
world economy[citation
needed]. As a result, the U.S.'s GDP per capita
converged on and eventually surpassed that of the U.K., as well as other
nations that it previously trailed economically. The economy has
maintained high wages, attracting immigrants by the millions from all
over the world.[45]
In the 19th century,
recessions frequently coincided with
financial crises.
The
Panic of 1837 was followed by a five-year depression, with the
failure of banks and then-record-high unemployment levels.[46]
Because of the great changes in the economy over the centuries, it is
difficult to compare the severity of modern recessions to early
recessions.[47]
Recessions after World War II appear to have been less severe than
earlier recessions, but the reasons for this are unclear.[48]
World's
largest economy
The United States has been the world's largest national economy since
at least the 1920s.[26]
For many years following the
Great Depression of the 1930s, when danger of
recession appeared most serious, the government strengthened the
economy by spending heavily itself or cutting taxes so that consumers
would spend more, and by fostering rapid growth in the money supply,
which also encouraged more spending. Ideas about the best tools for
stabilizing the economy changed substantially between the 1930s and the
1980s. From the
New
Deal era that began in 1933, to the
Great Society initiatives of the 1960s, national policy makers
relied principally on
fiscal policy to influence the economy.
The approach, advanced by British economist
John Maynard Keynes, gave elected officials a leading role in
directing the economy, since spending and taxes are controlled by the
U.S. President and the
Congress. The
"Baby Boom" saw a dramatic increase in fertility in the period
1942–1957; it was caused by delayed marriages and childbearing during
depression years, a surge in prosperity, a demand for suburban
single-family homes (as opposed to inner city apartments) and new
optimism about the future. The boom crested about 1957, then slowly
declined.[49]
A period of high inflation, interest rates and unemployment after 1973
weakened confidence in fiscal policy as a tool for regulating the
overall pace of economic activity.[50]
The U.S. economy grew by an
average of 3.8% from 1946 to 1973, while real median household
income surged 74% (or 2.1% a year).[51][52]
The economy since 1973, however, has been characterized by both slower
growth (averaging 2.7%), and nearly stagnant living standards, with
household incomes increasing by 10%, or only 0.3% annually.[53]
The worst recession in recent decades, in terms of lost output,
occurred during the
2008 financial crisis, when GDP fell by 5.0% from the spring of 2008
to the spring of 2009. Other significant recessions took place in
1957–58, when GDP fell 3.7%, following the
1973 oil crisis, with a 3.1% fall from late 1973 to early 1975, and
in the 1981–82 recession, when GDP dropped by 2.9%.[54][55]
Recent, mild recessions have included the 1990–91 downturn, when output
fell by 1.3%, and the 2001 recession, in which GDP slid by 0.3%; the
2001 downturn lasted just eight months.[55]
The most vigorous, sustained periods of growth, on the other hand, took
place from early 1961 to mid 1969, with an expansion of 53% (5.1% a
year), from mid 1991 to late in 2000, at 43% (3.8% a year), and from
late 1982 to mid 1990, at 37% (4% a year).[54]
In the 1970s and 1980s, it was popular in the U.S. to believe that
Japan's economy would surpass that of the United States, but this
didn't happen.[56]
Improving economies of some emerging countries
Since the 1970s several
emerging countries have begun to close the economic gap with the
United States. In most cases, this has been due to moving the
manufacture of goods formerly made in the U.S. to countries where they
could be made for sufficiently less money to cover the cost of shipping
plus a higher profit.
In other cases, some countries have gradually learned to produce the
same products and services that previously only the U.S. and a few other
countries could produce. Real income growth in the U.S. has slowed.
The
North American Free Trade Agreement, or
NAFTA, created the
largest trade bloc in the world in 1994.
Since 1976, the US has sustained merchandise trade deficits with
other nations, and since 1982,
current account deficits. The nation's long-standing surplus in its
trade in services was maintained, however, and reached a record
US$195 billion in 2012.[10]
In recent years, the primary economic concerns have centered on: high
household debt ($11 trillion, including $2.5 trillion in
revolving debt),[57]
high net national debt ($9 trillion), high corporate debt ($9 trillion),
high mortgage debt (over $15 trillion as of 2005 year-end), high
external debt (amount owed to foreign lenders), high
trade deficits, a serious deterioration in the United States
net international investment position (NIIP) (−24% of GDP),[58]
and high unemployment.[59]
In 2006, the U.S. economy had its lowest saving rate since 1933.[60]
These issues have raised concerns among economists and national
politicians.[61]
The United States economy experienced a crisis in 2008 led by a
derivatives market and
subprime mortgage crisis, and a declining dollar value.[62]
On December 1, 2008, the
NBER declared that the United States entered a
recession in December 2007, citing employment and production figures
as well as the third quarter decline in GDP.[63]
The recession did, however, lead to a reduction in record trade
deficits, which fell from $840 billion annually during the 2006–08
period, to $500 billion in 2009,[54][64]
as well as to higher personal savings rates, which jumped from a
historic low of 1% in early 2008, to nearly 5% in late 2009. The
merchandise trade deficit rose to $670 billion in 2010; savings rates,
however, remained at around 5%.[65]
The
U.S. public debt was $909 billion in 1980, an amount equal to 33.3%
of America's gross domestic product (GDP; by 1990, that number had more
than tripled to $3.2 trillion – or 55.9% of GDP.[66]
In 2001 the national debt was $5.7 trillion; however, the debt-to-GDP
ratio remained at 1990 levels.[67]
Debt levels rose quickly in the following decade, and on January 28,
2010, the US debt ceiling was raised to $14.3 trillion dollars.[68]
Based on the 2010
U.S. budget, total national debt will grow to nearly 100% of GDP,
versus a level of approximately 80% in early 2009.[69]
The White House estimates that the government’s tab for servicing the
debt will exceed $700 billion a year in 2019,[70]
up from $202 billion in 2009.[71]
The U.S. Treasury statistics indicate that, at the end of 2006,
non-US citizens and institutions held 44% of federal debt held by the
public.[72]
China, holding $801.5 billion in
treasury bonds, is the largest foreign financier of the record U.S.
public debt.[73]
US share of world GDP (nominal) peaked in 1985 with 32.74% of global
GDP (nominal). Its second highest share was 32.24% in 2001.
US share of world GDP (PPP) peaked in 1999 with 23.78% of global GDP
(PPP). While its share has been declining each year since 1999, it is
still the highest in the world.
Overview
A central feature of the U.S. economy is the economic freedom
afforded to the private sector by allowing the private sector to make
the majority of economic decisions in determining the direction and
scale of what the U.S. economy produces.[74]
This is enhanced by relatively low levels of regulation and government
involvement,[75]
as well as a court system that generally protects
property rights and enforces contracts. Today, the United States is
home to 29.6 million small businesses, 30% of the world's millionaires,
40% of the world's billionaires, as well as 139 of the world's 500
largest companies.[28][76][77][78]
From its emergence as an independent nation, the United States has
encouraged science and innovation. As a result, the United States has
been the birthplace of 161 of
Britannica's 321 Great Inventions, including items such as the
airplane, internet,
microchip,
laser,
cellphone,
refrigerator, email,
microwave,
Personal Computer,
LCD and
LED technology,
air conditioning,
assembly line, supermarket,
bar code,
electric motor,
ATM, and many more.[79]
The United States is rich in mineral resources and fertile farm soil,
and it is fortunate to have a moderate climate. It also has extensive
coastlines on both the
Atlantic and Pacific Oceans, as well as on the
Gulf of Mexico. Rivers flow from far within the continent and the
Great Lakes—five large, inland lakes along the U.S. border with
Canada—provide additional shipping access. These extensive waterways
have helped shape the country's economic growth over the years and
helped bind America's 50 individual states together in a single economic
unit.[80]
The number of workers and, more importantly, their productivity help
determine the health of the U.S. economy. Throughout its history, the
United States has experienced steady growth in the labor force, a
phenomenon that is both cause and effect of almost constant economic
expansion. Until shortly after World War I, most workers were immigrants
from Europe, their immediate descendants, or African Americans who were
mostly slaves taken from Africa, or slave descendants.[81]
Beginning in the late 20th century, many
Latin Americans immigrated, followed by large numbers of
Asians after the removal of nation-origin based immigration quotas.[82]
The promise of high wages brings many highly skilled workers from around
the world to the United States. Over 13 million people entered the
United States during the 1990s alone.[83]
Labor mobility has also been important to the capacity of the
American economy to adapt to changing conditions.[citation
needed] When immigrants flooded labor markets on
the East Coast, many workers moved inland, often to farmland waiting to
be tilled. Similarly, economic opportunities in industrial, northern
cities attracted black Americans from
southern farms in the first half of the 20th century, in what was
known as the
Great Migration.
In the United States, the corporation has emerged as an association
of owners, known as stockholders, who form a business enterprise
governed by a complex set of rules and customs. Brought on by the
process of
mass production, corporations, such as
General Electric, have been instrumental in shaping the United
States. Through the
stock market, American banks and investors have grown their economy
by investing and withdrawing capital from profitable corporations. Today
in the era of
globalization, American investors and corporations have influence
all over the world. The American government is also included among the
major investors in the American economy. Government investments have
been directed towards public works of scale (such as from the
Hoover Dam), military-industrial contracts, and the financial
industry.
-
-
United States wealth compared to the rest of the world in
the year 2000.
-
Year-on-year change in total net worth of US households and
nonprofit organizations 1946–2007, unadjusted for inflation
or population change.
-
The number of Americans in poverty and poverty rate - 1959
to 2009.
Employment
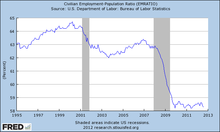
Percent of US population employed, 1995–2012

United States Labor Force Participation Rate from 1948 to
2011 by gender. Men are represented in light blue, women in
pink, and the total in black.
There are approximately 154.4 million employed individuals in the US.
Government is the largest employment sector with 22 million.[84]
Small businesses are the largest employer in the country representing
53% of US workers.[77]
The second largest share of employment belongs to large businesses that
employ 38% of the US workforce.[77]
The
private sector employs 91% of Americans.
Government accounts for 8% of all US workers. Over 99% of all
employing organizations in the US are small businesses.[77]
The 30 million small businesses in the U.S. account for 64% of newly
created jobs (those created minus those lost).[77]
Jobs in small businesses accounted for 70% of those created in the last
decade.[85]
The proportion of Americans employed by small business versus large
business has remained relatively the same year by year as some small
businesses become large businesses and just over half of small
businesses survive more than 5 years.[77]
Amongst large businesses, several of the largest companies and employers
in the world are
American companies. Amongst them are
Walmart,
the largest company and the largest
private sector employer in the world, which employs 2.1 million
people world-wide and 1.4 million in the US alone.[86][87]

United States mean duration of unemployment 1948–2010.
There are nearly 30 million small businesses in the US. Minorities
such as
Hispanics, African Americans, Asian Americans, and Native Americans
(35% of the country's population),[88]
own 4.1 million of the country's businesses. Minority-owned businesses
generate almost $700 billion in revenue and employ almost 5 million
workers in the U.S.[77]
The median household income in the US as of 2008 is $52,029.[90]
About 284,000 working people in the US have two full-time jobs and
7.6 million have a part-time job in addition to their full-time
employment.[84]
Of working individuals in the US, 12% belong to a labor union; most
union members are government workers.[84]
Unemployment
In May 2009, the unemployment rate was 9.4%.[91]
A broader measure of unemployment (taking into account marginally
attached workers, those employed part-time for economic reasons, and
discouraged workers) was 15.9%.[92]
In 2009 and 2010, following the
financial crisis of 2007–2010, the emerging problem of
jobless recoveries resulted in record levels of
long-term unemployment with over 6 million workers looking for work
longer than 6 months as of January, 2010. This particularly affected
older workers.[59]
Since the recession's end in June 2009 in the United States, immigrants
have gained 656,000 jobs, while U.S.-born workers lost more than a
million jobs.[93]
In April 2010, the official unemployment rate was 9.9%, but the
government’s broader U-6 unemployment rate was 17.1%.[94]
In the period between February 2008 and February 2010, the number of
people working part-time for economic reasons has increased by 4 million
to 8.8 million, an 83% increase in part-time workers during the two-year
period.[95]
Female unemployment continued to be significantly lower than male
unemployment (7.5% vs. 9.8%). The unemployment among Caucasians
continues to be much lower than African American unemployment (at 8.5%
vs. 15.8%).[91]
The youth unemployment rate was 18.5% in July 2009, the highest July
rate since 1948.[96]
The unemployment rate of young African American men was 34.5% in October
2009.[97]
Officially, Detroit’s unemployment rate is 27%, but Detroit News
suggests that nearly half of this city’s working-age population may be
unemployed.[98]
In 1955, 55% of Americans worked in services, between 30% and 35% in
industry, and between 10% and 15% in
agriculture. By 1980, over 65% were employed in services, between
25% and 30% in industry, and less than 5% in agriculture.[99]
Research, development, and entrepreneurship
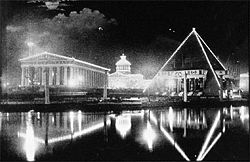
Tennessee in 1897. The United States was a leader in the
adoption of
electric lighting.
The United States has been a leader in scientific research and
technological innovation since the late 19th century. In 1876,
Alexander Graham Bell was awarded the first U.S.
patent for the telephone.
Thomas Edison's laboratory developed the
phonograph, the first
long-lasting light bulb, and the first viable
movie camera.
Nikola Tesla pioneered the AC
induction motor and high frequency power transmission used in radio.
In the early 20th century, the automobile companies of
Ransom E. Olds and
Henry Ford popularized the
assembly line. The
Wright brothers, in 1903, made the
first sustained and controlled heavier-than-air powered flight.[100]
Entrepreneurship is the act of being an entrepreneur, which can be
defined as "one who undertakes
innovations, finance and business acumen in an effort to transform
innovations into economic goods". This may result in new organizations
or may be part of revitalizing mature organizations in response to a
perceived opportunity.[101]
The most obvious form of entrepreneurship is that of starting new
businesses (referred as
Startup Company); however, in recent years, the term has been
extended to include social and political forms of entrepreneurial
activity. When entrepreneurship is describing activities within a firm
or large organization it is referred to as intra-preneurship and may
include corporate venturing, when large entities spin-off organizations.[102]
According to Paul Reynolds, entrepreneurship scholar and creator of
the
Global Entrepreneurship Monitor, "by the time they reach their
retirement years, half of all working men in the United States probably
have a period of self-employment of one or more years; one in four may
have engaged in self-employment for six or more years. Participating in
a new business creation is a common activity among U.S. workers over the
course of their careers."[103]
And in recent years has been documented by scholars such as
David Audretsch to be a major driver of economic growth in both the
United States and Western Europe.
Venture capital, as an industry, originated in the United States and
it is still dominated by the U.S.[104]
According to the National Venture Capital Association 11% of private
sector jobs come from venture capital backed companies and venture
capital backed revenue accounts for 21% of US GDP.[105]
Some new American businesses raise investments from
angel investors (venture capitalists). In 2010 healthcare/medical
accounted for the largest share of angel investments, with 30% of total
angel investments (vs. 17% in 2009), followed by software (16% vs. 19%
in 2007), biotech (15% vs. 8% in 2009), industrial/energy (8% vs. 17% in
2009), retail (5% vs. 8% in 2009) and IT services (5%).[106][clarification
needed]
Americans are “venturesome consumers” who are unusually willing to
try new products of all sorts, and to pester manufacturers to improve
their products.[107]
Income and wealth
According to the
United States Census Bureau, the pretax
median household income in 2007 was $50,233. The median ranged from
$68,080 in
Maryland to $36,338 in
Mississippi.[108]
In 2007, the median real annual household income rose 1.3% to
$50,233, according to the
Census Bureau.[109]
The real median earnings of men who worked full-time, year-round climbed
between 2006 and 2007, from $43,460 to $45,113. For women, the
corresponding increase was from $33,437 to $35,102. The median income
per household member (including all working and non-working members
above the age of 14) was $26,036 in 2006.[110]
The average home in the United States has more than 700 square feet
per person, which is 50%–100% more than the average in other high-income
countries. Even in the lowest income percentiles people enjoy more space
– average 400 square feet per person – than middle classes in Europe do.
Likewise, ownership rates of gadgets and amenities are exceptionally
high compared to other countries.[111][112][113]
The recently released US Income Mobility Study showed economic growth
resulted in rising incomes for most taxpayers over the period from 1996
to 2005. Median incomes of all taxpayers increased by 24 percent after
adjusting for inflation. The real incomes of two-thirds of all taxpayers
increased over this period. Income mobility of individuals was
considerable in the U.S. economy during the 1996 through 2004 period
with roughly half of taxpayers who began in the bottom quintile moving
up to a higher income group within 10 years. In addition, the median
incomes of those initially in the lower income groups increased more
than the median incomes of those initially in the higher income groups.[114]
Between June 2007 and November 2008 the global recession led to
falling asset prices around the world. Assets owned by Americans lost
about a quarter of their value.[115]
Since peaking in the second quarter of 2007, household wealth is down
$14 trillion.[116]
The Fed also said that at the end of 2008, the debt owed by nonfinancial
sectors was $33.5 trillion, including household debt valued at
$13.8 trillion.[117]
About 30% of the entire world's millionaire population resides in the
United States (in 2009).[118]
The
Economist Intelligence Unit estimated in 2008 that there were
16,600,000 millionaires in the U.S.[119]
Furthermore, 34% of the world's billionaires are American (in 2011).[76][120]
Financial position

Components of total US debt as a fraction of GDP 1945–2009
The overall financial position of the United States as of 2009
includes $50.7 trillion of debt owed by US households, businesses, and
governments, representing more than 3.5 times the annual gross domestic
product of the United States.[34]
As of the first quarter of 2010, domestic financial assetsA
totaled $131 trillion and domestic financial liabilities $106 trillion.[36]
Tangible assets in 2008 (such as real estate and equipment) for selected
sectorsB
totaled an additional $56.3 trillion.[121]
Since 2010, the U.S. Treasury has been obtaining
negative real interest rates on government debt.[122]
Such low rates, outpaced by the
inflation rate, occur when the market believes that there are no
alternatives with sufficiently low risk, or when popular institutional
investments such as insurance companies,
pensions,
or bond, money market, and balanced
mutual funds are required or choose to invest sufficiently large
sums in Treasury securities to hedge against risk.[123][124]
Lawrence Summers,
Matthew Yglesias and other economists state that at such low rates,
government debt borrowing saves taxpayer money, and improves
creditworthiness.[125][126]
In the late 1940s through the early 1970s, the US and UK both reduced
their debt burden by about 30% to 40% of GDP per decade by taking
advantage of negative real interest rates, but there is no guarantee
that government debt rates will continue to stay so low.[123][127]
In January, 2012, the U.S. Treasury Borrowing Advisory Committee of the
Securities Industry and Financial Markets Association unanimously
recommended that government debt be allowed to auction even lower, at
negative absolute interest rates.[128]
Now that the connection between public and private debt is
better-known,[129][130]
U.S. combined debts are worrisome. See
Causes of the Great Depression: Debt Deflation.
Composition

A
Boeing 747-8 wing-fuselage sections during final
assembly.
Although most of the U.S. economy is composed of services, the United
States is the world's largest manufacturer, with a 2009 industrial
output of US$2.33 trillion. Its manufacturing output is greater than of
Germany, France, India, and Brazil combined.[131]
Main industries include petroleum, steel, automobiles, construction
machinery, aerospace, agricultural machinery, telecommunications,
chemicals, electronics, food processing, consumer goods, lumber, and
mining. The US leads the world in
airplane manufacturing,[132]
which represents a large portion of US industrial output. American
companies such as
Boeing,
Cessna
(see:
Textron),
Lockheed Martin (see:
Skunk Works), and
General Dynamics produce a vast majority of the world's civilian and
military aircraft in factories stretching across the United States.
The manufacturing sector of the U.S. economy has experienced
substantial job losses over the past several years.[133][134]
In January 2004, the number of such jobs stood at 14.3 million, down by
3.0 million jobs, or 17.5 percent, since July 2000 and about 5.2 million
since the historical peak in 1979. Employment in manufacturing was its
lowest since July 1950.[135]
The number of steel workers fell from 500,000 in 1980 to 224,000 in
2000.[136]
The U.S. produces approximately 18% of the world's manufacturing
output, a number that has declined as other nations developed
competitive manufacturing industries.[131]
The job loss during this continual volume growth is the result of
multiple factors including increased productivity, trade, and secular
economic trends.[137]
In addition, growth in telecommunications, pharmaceuticals, aircraft,
heavy machinery and other industries along with declines in low end, low
skill industries such as clothing, toys, and other simple manufacturing
have resulted in U.S. jobs being more highly skilled and better paying.[citation
needed] There has been much debate within the
United States on the decline in manufacturing jobs are related to
American Unions and lower foreign wages.[138][139][140]
Although
agriculture comprises less than two percent of the economy, the
United States is a net exporter of food. With vast tracts of
temperate arable land, technologically advanced
agribusiness, and
agricultural subsidies, the United States controls almost half of
world
grain exports.[141]
Products include wheat, corn, other
grains, fruits, vegetables, cotton; beef, pork, poultry, dairy
products;
forest products; fish.
Notable
companies and markets

A typical Walmart discount department store (location:
Laredo, Texas).
In 2011, the 20
largest U.S.-based companies by revenue were
Walmart,
ExxonMobil,
Chevron,
ConocoPhillips,
Fannie Mae,
General Electric,
Berkshire Hathaway,
General Motors,
Ford Motor Company and
Hewlett-Packard,
AT&T,
Cargill,
McKesson Corporation,
Bank of America,
Federal Home Loan Mortgage Corporation,
Apple Inc.,
Verizon,
JPMorgan Chase, and
Cardinal Health.
In 2011, four of the world's ten
largest companies by market capitalization were American:
Exxon Mobil,
Apple Inc.,
Chevron Corporation, and
Microsoft.
According to
Fortune Global 500 2011, the
ten largest U.S. employers were
Walmart,
U.S. Postal Service,
IBM,
UPS,
McDonald's,
Target Corporation,
Kroger,
Home Depot,
General Electric, and
Sears Holdings.
Apple,
Google, IBM,
McDonald's, and
Microsoft are the world's five most valuable brands in an index
published by Millward Brown.[142]
A 2012 Deloitte report published in STORES magazine indicated
that of the world's top 250 largest retailers by retail sales revenue in
fiscal year 2010, 32% of those retailers were based in the United
States, and those 32% accounted for 41% of the total retail sales
revenue of the top 250.[143]
Amazon.com is the world's largest online retailer.
Half of the world's 20
largest semiconductor manufacturers by sales were American-origin in
2011.[144]
Most of the
world's largest charitable foundations were founded by Americans.
American producers create nearly all of
the world's highest-grossing films. Many of
the world's best-selling music artists are based in the United
States.
U.S. tourism sector welcomes approximately 60 million international
visitors every year.
Energy, transportation, and telecommunications
The United States is the second largest
energy consumer in total use.[145]
The U.S. ranks seventh in energy consumption per-capita after Canada and
a number of other countries.[146][147]
The majority of this energy is derived from
fossil fuels: in 2005, it was estimated that 40% of the nation's
energy came from petroleum, 23% from coal, and 23% from natural gas.
Nuclear power supplied 8.4% and
renewable energy supplied 6.8%, which was mainly from hydroelectric
dams although other renewables are included.[148]
American dependence on
oil imports grew from 24% in 1970 to 65% by the end of 2005. At that
rate of unchecked import growth, the US would have been 70% to 75%
reliant on
foreign oil by about 2015.[149]
Transportation has the highest
consumption rates, accounting for approximately 68.9% of the oil
used in the United States in 2006,[150]
and 55% of oil use worldwide as documented in the
Hirsch report.
In 2011, the United States imported 3,324 million barrels of
crude oil, compared to 3,377 million barrels in 2010.[151]
While the U.S. is the largest importer of fuel, the
Wall Street Journal reported in 2011 that the country was about to
become a net fuel exporter for the first time in 62 years. The paper
reported expectations that this would continue until 2020.[152]
In fact, petroleum was the major export from the country in 2011.[153]
Internet was developed in the U.S. and the country hosts many of the
world's largest hubs.
Finance
Measured by
value of its listed companies'
securities, the
New York Stock Exchange is more than three times larger than any
other stock exchange in the world.[154]
As of October 2008, the combined
capitalization of all domestic NYSE listed companies was
US$10.1 trillion.[155]
NASDAQ
is another American
stock exchange and the world's 3rd largest exchange after the
New York Stock Exchange and Japan's
Tokyo Stock Exchange. However NASDAQ's
trade value is larger than Japan's TSE.[154]
NASDAQ is the largest
electronic screen-based
equity
securities trading market in the U.S. With approximately 3,800
companies and corporations, it has more trading volume per hour than any
other stock exchange.[156]
International
trade

Graphical depiction of United States' product exports in 28
color-coded categories.

U.S. Trade in Goods and Services 1960–2010.
The United States is the world's largest trading nation. There is a
high amount of U.S. dollars in circulation all around the planet. The
dollar is also used as the standard unit of currency in international
markets for commodities such as gold and petroleum.
In 2010, U.S. exports amounted to $1.3 trillion and imports amounted
to $1.9 trillion. Trade deficit was $634.9 billion.[157]
The deficit on petroleum products was $270 billion. The trade deficit
with China
was $295 billion in 2011,[158]
a new record and up from $304 million in 1983.[159]
The United States had a $168 billion surplus on trade in services,
and $803 billion deficit on trade in goods in 2010.[160][161]
China has expanded its foreign exchange reserves, which included
$1.6 trillion of U.S.
securities as of 2009.[162]
In 2010, the ten
largest trading partners of the U.S. were Canada, China, Mexico,
Japan, Germany, the United Kingdom, South Korea, France, Taiwan, and
Brazil.
According to the
KOF Index of Globalization and the
Globalization Index by A.T. Kearney/Foreign Policy Magazine, the
U.S. has a relatively high degree of globalization. U.S. workers send a
third of all
remittances in the world.[163]
Currency
and central bank

United States historical inflation rate, 1666–2004.
The United States dollar is the unit of currency of the United
States. The U.S. dollar is the currency most used in international
transactions.[164]
Several countries
use it as their official currency, and in many others it is the
de facto currency.[165]
The federal government attempts to use both
monetary policy (control of the money supply through mechanisms such
as changes in interest rates) and
fiscal policy (taxes and spending) to maintain low inflation, high
economic growth, and low unemployment. A private
central bank, known as the
Federal Reserve, was formed in 1913 to supposedly provide a stable
currency and
monetary policy. The U.S. dollar has been regarded as one of the
more stable currencies in the world and many nations back their own
currency with U.S. dollar reserves.
The U.S. dollar has maintained its position as the world's primary
reserve currency, although it is gradually being challenged in that
role.[166]
Almost two-thirds of currency reserves held around the world are held in
US dollars, compared to around 25% for the next most popular currency,
the Euro.[167]
Rising US national debt and
quantitative easing has caused some to predict that the US Dollar
will lose its status as the world's reserve currency, however these
predictions have not come to fruition.[168]
Law and government

Revenue and Expense as % GDP.

Deficit and debt increases 2001–2012.
The United States ranked 4th in the
Ease of Doing Business Index in 2012, 18th in the
Economic Freedom of the World index by the Fraser Institute in 2012,
10th in the
Index of Economic Freedom by the Wall Street Journal and Heritage
Foundation in 2012, and 19th in the 2010
Global Enabling Trade Report.
Regulations
The
U.S. federal government regulates private enterprise in numerous
ways. Regulation falls into two general categories.
Some efforts seek, either directly or indirectly, to control prices.
Traditionally, the government has sought to create state-regulated
monopolies such as electric utilities from while allowing prices in
the level that would ensure them normal profits. At times, the
government has extended economic control to other kinds of industries as
well. In the years following the Great Depression, it devised a complex
system to stabilize prices for agricultural goods, which tend to
fluctuate wildly in response to rapidly changing supply and demand. A
number of other industries—trucking and, later, airlines—successfully
sought regulation themselves to limit what they considered as harmful
price-cutting, a process called
regulatory capture.[169]
Another form of economic regulation,
antitrust law, seeks to strengthen market forces so that direct
regulation is unnecessary. The government—and, sometimes, private
parties—have used antitrust law to prohibit practices or mergers that
would unduly limit competition.[169]
Bank regulation in the United States is highly fragmented compared
to other
G10 countries where most countries have only one bank regulator. In
the U.S., banking is regulated at both the federal and state level. The
U.S. also has one of the most highly regulated banking environments in
the world; however, many of the regulations are not safety and soundness
related, but are instead focused on privacy, disclosure, fraud
prevention, anti-money laundering, anti-terrorism, anti-usury
lending, and promoting lending to lower-income segments.[citation
needed]
Since the 1970s, government has also exercised control over private
companies to achieve social goals, such as improving the public's health
and safety or maintaining a healthy environment. For example, the
Occupational Safety and Health Administration provides and enforces
standards for workplace safety, and the
United States Environmental Protection Agency provides standards and
regulations to maintain air, water, and land resources. The U.S.
Food and Drug Administration regulates what drugs may reach the
market, and also provides standards of disclosure for food products.[169]
American attitudes about regulation changed substantially during the
final three decades of the 20th century. Beginning in the 1970s, policy
makers grew increasingly convinced that economic regulation protected
companies at the expense of consumers in industries such as airlines and
trucking. At the same time, technological changes spawned new
competitors in some industries, such as telecommunications, that once
were considered natural monopolies. Both developments led to a
succession of laws easing regulation.[169]
While leaders of America's two most influential political parties
generally favored economic
deregulation during the 1970s, 1980s, and 1990s, there was less
agreement concerning regulations designed to achieve social goals.
Social regulation had assumed growing importance in the years following
the Depression and World War II, and again in the 1960s and 1970s.
During the 1980s, the government relaxed labor, consumer and
environmental rules based on the idea that such regulation interfered
with
free enterprise, increased the costs of doing business, and thus
contributed to inflation. The response to such changes is mixed; many
Americans continued to voice concerns about specific events or trends,
prompting the government to issue new regulations in some areas,
including environmental protection.[169]
Where legislative channels have been unresponsive, some citizens have
turned to the courts to address social issues more quickly. For
instance, in the 1990s, individuals, and eventually the government
itself, sued tobacco companies over the health risks of cigarette
smoking. The 1998
Tobacco Master Settlement Agreement provided states with long-term
payments to cover medical costs to treat smoking-related illnesses.[169]
Between 2000 and 2008, economic regulation in the United States saw
the most rapid expansion since the early 1970s.[172]
The number of new pages in the Federal Registry, a proxy for economic
regulation, rose from 64,438 new pages in 2001 to 78,090 in new pages in
2007, a record amount of regulation.[172]
Economically significant regulations, defined as regulations which cost
more than $100 million a year, increased by 70%.[172]
Spending on regulation increased by 62% from $26.4 billion to $42.7
billion.[172]
Taxation
Taxation in the United States is a complex system which may involve
payment to at least four different levels of government and many methods
of taxation. Taxes are levied by the
federal government, by the
state governments, and often by
local governments, which may include
counties, municipalities,
township,
school districts, and other
special-purpose districts, which include fire, utility, and transit
districts.

The average tax rate percentages for the highest-income U.S.
taxpayers, 1945-2009.
Forms of taxation include taxes on income, property, sales, imports,
payroll, estates and gifts, as well as various fees. When taxation by
all government levels taken into consideration, the
total taxation as percentage of GDP was approximately a quarter of
GDP in 2011.[173]
Share of
black market in the U.S. economy is very low compared to other
countries.[174]
Expenditure

Fiscal Year 2011 U.S. Federal Spending – Cash or Budget
Basis.

Fiscal Year 2011 U.S. Federal Receipts.
The United States public-sector spending amounts to about one-third
of the GDP.
Each level of government provides many direct services. The federal
government, for example, is responsible for national defense, backs
research that often leads to the development of new products, conducts
space exploration, and runs numerous programs designed to help workers
develop workplace skills and find jobs (including higher education).
Government spending has a significant effect on local and regional
economies—and even on the overall pace of economic activity.[citation
needed]
State governments, meanwhile, are responsible for the construction
and maintenance of most highways. State, county, or city governments
play the leading role in financing and operating public schools. Local
governments are primarily responsible for police and fire protection.[citation
needed]
The
welfare system in the United States began in the 1930s, during the
Great Depression. After the
Great Society legislation of the 1960s, for the first time "a poor
person who was neither elderly nor crippled could eke out a livelihood
from the state".[175]
Overall, federal, state, and local spending accounted for almost 28%
of gross domestic product in 1998.[176]
As of January 20, 2009, the total U.S. federal debt was
$10.627 trillion.[177]
The borrowing-cap debt ceiling as of 2005 stood at $8.18 trillion.[178]
In March 2006, Congress raised that ceiling an additional $0.79 trillion
to $8.97 trillion, which is approximately 68% of GDP.[179]
Congress has used this method to deal with an encroaching debt ceiling
in previous years, as the federal borrowing limit was raised in 2002 and
2003.[180]
As of October 4, 2008, the "Emergency
Economic Stabilization Act of 2008" raised the current debt ceiling
to US$ 11.3 trillion.[181]
The federal government's debt rose by $1.09 trillion in 2012,[15]
and now stands at $16.158 trillion.[13]
While the U.S. public debt is the world's largest in absolute size,
another measure is its size relative to the nation's GDP. As of October
2012 the debt was 100.4% of GDP.[35]
This debt, as a percent of GDP, is still less than the debt of
Japan (192%) (the overwhelming number of owners of
JGBs are Japanese)[182]
and roughly equivalent to those of a few western European nations.[183]
See also
Events:
Lists:
References
- ^
a
b
"National Economic Trends (Nominal GDP)" (PDF). Federal
Reserve Bank of St. Louis. January 30, 2013. p. 24.
Retrieved January 31, 2013.
- ^
a
b
c
d
e
"United States". International Monetary Fund.
Retrieved January 4, 2013.
-
^
World Economic Outlook Update
-
^
"National Economic Trends (Consumer Price Index)" (PDF).
Federal Reserve Bank of St. Louis. February 22, 2013. p. 28.
Retrieved February 25, 2013.
-
^
"Income, Poverty, and Health Insurance Coverage in the United
States: 2011" (PDF). September 2012. p. 13.
Retrieved January 4, 2013.
-
^
"Income, Poverty and Health Insurance Coverage in the United
States: 2011". Newsroom.
United States Census Bureau. September 12, 2012.
Retrieved January 23, 2013.
- ^
a
b
"Economic News Release: Employment Situation Summary Table A.
Household data, seasonally adjusted". BLS.gov. February 1,
2013. Retrieved February 1,
2013.
-
^
"Occupational Employment and Wages News Release (May 2011)".
BLS.gov. March 27, 2012.
Retrieved October 5, 2012.
-
^
"Doing Business in the United States 2013".
World Bank. Retrieved
January 23, 2013.
-
^
a
b
c
"U.S. International Trade in Goods and Services" (PDF). BEA.
February 8, 2013. Retrieved
February 11, 2013.
-
^
"Foreign Direct Investment (FDI) in the United States".
International Investment.
Retrieved November 22, 2011.
-
^
"Debt - External". The CIA World Factbook.
-
^
a
b
"The Debt to the Penny and Who Holds It". Treasury Direct.
February 22, 2013. Retrieved
February 22, 2013.
-
^
"World Economic Outlook Database, October 2012". IMF.
Retrieved February 22, 2013.
- ^
a
b
c
d
"Deficit tops $1 trillion for 4th straight year". CNN Money.
October 6, 2012.
-
^
Biggest donors by GDP, BBC News,
retrieved November 17, 2008
-
^
"Sovereigns rating list". Standard & Poor's.
Retrieved August 20, 2011.
- ^
a
b
c
Rogers,
Simon; Sedghi, Ami (April 15, 2011).
"How Fitch, Moody's and S&P rate each country's credit rating".
The Guardian (London).
Retrieved May 28, 2011.
-
^
Riley, Charles (August 2, 2011).
"Moody's affirms AAA rating, lowers outlook". CNN.
-
^
"United States: International Reserves and Foreign Currency
Liquidity".
International Monetary Fund. December 14, 2012.
Retrieved January 4, 2013.
-
^
"Gross national income per capita 2011, Atlas method and PPP"
(PDF).
World Bank. July 9, 2012.
Retrieved July 28, 2012.
-
^ Wright, Gavin, and
Jesse Czelusta, "Resource-Based Growth Past and Present", in
Natural Resources: Neither Curse Nor Destiny, ed. Daniel
Lederman and William Maloney (World Bank, 2007), p. 185.
ISBN 0-8213-6545-2.
-
^
The Guardian - 11 February 2013 - China overtakes US in world
trade - by Phillip Inman
-
^
U.S. Economy and Business – Conditions and Resources. U.S.
Department of State. "The United States is said to have a mixed
economy because privately owned businesses and government both
play important roles." Accessed: October 24, 2011.
-
^
(4)Outline of the U.S. Economy – (2)How the U.S. Economy Works.
U.S. Embassy Information Resource Center. "As a result, the
American economy is perhaps better described as a "mixed"
economy, with government playing an important role along with
private enterprise. Although Americans often disagree about
exactly where to draw the line between their beliefs in both
free enterprise and government management, the mixed economy
they have developed has been remarkably successful." Accessed:
October 24, 2011.
-
^
a
b
Digital
History, Steven Mintz.
"Digital History". Digitalhistory.uh.edu.
Retrieved April 21, 2012.
-
^
Vargo, Frank (March 11, 2011).
"U.S. Manufacturing Remains World’s Largest". Shopfloor.
Retrieved March 28, 2012.
-
^
a
b
"Global 500 2010: Countries". CNN.
-
^
Rankings: Global Competitiveness Report 2008-2009,
World Economic Forum,
retrieved October 12, 2008[dead
link] Click the link "Rankings" to access
the entire list.
-
^
http://globalindex11.bsa.org/country-table/
-
^
http://www.sfc.hk/web/doc/EN/research/stat/a01.pdf
-
^
"CIA – The World Factbook". Cia.gov.
Retrieved April 21, 2012.
-
^
"CIA – The World Factbook". Cia.gov.
Retrieved April 21, 2012.
-
^
a
b
31, 2010 Components of US debt,
retrieved July 3, 2010
- ^
a
b
"World Debt". usdebtclock.org.
Retrieved January 31, 2013.
-
^
a
b
Flow of Funds report, p. L.5, L.125,
retrieved July 3, 2010
-
^
http://www.federalreserve.gov/monetarypolicy/beigebook/default.htm
-
^
http://www.federalreserve.gov/otherfrb.htm
-
^
http://www.bea.gov/
-
^
http://bea.gov/newsreleases/rels.htm
-
^
http://www.bls.gov/
-
^
http://www.census.gov/cgi-bin/briefroom/BriefRm
-
^
http://www.cbpp.org/cms/index.cfm?fa=view&id=3252
-
^
http://data.bls.gov/timeseries/LNS14000000
-
^ "Persons
Obtaining Legal Permanent Resident Status in the United States
of America", US Department of Homeland Security.
-
^ W. J. Rorabaugh,
Donald T. Critchlow, Paula C. Baker (2004). "America's
promise: a concise history of the United States". Rowman
& Littlefield. p.210.
ISBN 0-7425-1189-8
-
^
Moore,
Geoffrey H.; Zarnowitz (1986),
"Appendix A The Development and Role of the National Bureau of
Economic Research's Business Cycle Chronologies" in
Gordon 1986, pp. 743–745[clarification
needed]
-
^
Knoop, Todd A.
(July 30, 2004), Recessions and Depressions: Understanding
Business Cycles, Praeger Publishers, pp. 166–71,
ISBN 0-275-98162-2
-
^ Steven Mintz and
Susan Kellogg, Domestic Revolutions: a Social History of
American Family Life (1988) ch 9
-
^
Buchanan, James
M.; Wagner, Richard E. (1977),
Democracy in Deficit: The Political Legacy of Lord Keynes,
New York: Academic Press, pp. 1–55,
ISBN 0-86597-227-3,
retrieved January 19, 2011
-
^
"Current Population Reports: Money Income of Households and
Persons in the United States (1987)". U.S. Department of
Commerce.
-
^
"Current Population Reports: Income of nonfarm families and
individuals (1946)". U.S. Department of Commerce.
-
^
Income, Poverty, and Health Insurance Coverage the United
States (2008), Census Bureau,
retrieved November 17, 2008
- ^
a
b
c
Global Crisis News, GCN,
retrieved June 17, 2009
- ^
a
b
Worries grow of deeper U.S. recession, CNN, archived
from
the original on June 11, 2008,
retrieved November 17, 2008
-
^
"Is China facing a Japanese future?", Time, February
14, 2011, retrieved February
27, 2012
-
^
Zuckerman, Mortimer B. (December 15–22, 2008), Editorial:
Heading Off a Depression, US News and World Report
-
^ Bivens, L. Josh
(December 14, 2004).
Debt and the dollar Economic Policy Institute.
Retrieved on July 8, 2007.
- ^
a
b
"Millions of Unemployed Face Years Without Jobs" article by
Peter S. Goodman in
The New York Times February 20, 2010
-
^ Associated Press
(January 30, 2006).US
savings rate hits lowest level since 1933MSNBC.
Retrieved on May 6, 2007.
-
^ Cauchon, Dennis
and John Waggoner (October 3, 2004). The Looming National
Benefit Crisis. USA Today
-
^
dollar hits record low against euro, oil prices rally
-
^
US recession 'began last year', BBC News, December 1,
2008, retrieved December 1,
2008
-
^
"Department of Commerce: Top U.S. Trade Partners".
Ita.doc.gov. Retrieved April
21, 2012.
-
^
"BEA: Personal income and its disposition, 2000–09".
Bea.gov. March 30, 2012.
Retrieved April 21, 2012.
-
^
FY 2010 Budget Historical Tables Pages 127–128[dead
link]
-
^ "US
spends its way to 28 Eiffel towers: made out of pure gold".
The Times. March 17, 2006.
-
^ "Senate
backs increase in debt limit to $14.3 trillion". Reuters.
January 28, 2010.
-
^
2010 Budget-Summary Tables S-13 and S-14[dead
link]
-
^ "Debt
has become America's life blood". Abc.net.au. December 15,
2009.
-
^ "Wave
of Debt Payments Facing US Government". The New York
Times. November 22, 2009.
-
^ "Analytical
Perspectives of the FY 2008 Budget".
-
^ "Washington
learns to treat China with care". CNNMoney.com. July 29,
2009.
-
^
Index of Economic Freedom – United States,
Heritage.org, retrieved
November 17, 2008
-
^
Anderson, Jack
(May 22, 2006),
"Tax Misery & Reform Index", Forbes,
retrieved November 17, 2008
-
^
a
b
"Forbes". Forbes. March 14, 2011.
- ^
a
b
c
d
e
f
g
"Office of Advocacy – Frequently Asked Questions – How important
are small businesses to the U.S. economy?". SBA.gov.
Retrieved April 21, 2012.
-
^
"Where the millionaires are now – MSN Money".
Articles.moneycentral.msn.com. October 22, 2007.
Retrieved April 21, 2012.
-
^
Encyclopædia Britannica's Great InsubSectorCode=39ventions",
Encyclopædia Britannica
-
^
U.S. Department of state: How the U.S. Economy Works
Retrieved December 1, 2008
-
^ "Trends
in International Migration 2002: Continuous Reporting System on
Migration". Organisation for Economic Co-Operation and
Development (2003). OECD Publishing. p.280.
ISBN 92-64-19949-7
-
^
Peter
S. Canellos (November 11, 2008),
"Obama victory took root in Kennedy-inspired Immigration Act",
The Boston Globe,
retrieved November 14, 2008
-
^ "An
Introduction to Bilingualism: Principles and Processes".
Jeanette Altarriba, Roberto R. Heredia (2008). p.212.
ISBN 0-8058-5135-6
-
^
a
b
c
McFeatters, Dale (September 6, 2010).
"Saluting 154 million in workforce on Labor Day". Napa
Valley Register.
-
^
"Obama: Small Business 'Heart' of Economy – YouTube".
Youtube. Retrieved April
21, 2012.
-
^
"Global 500 2010: Global 500 1–100". CNN.
-
^
Walmart Corporate and Financial Facts, August 2011
-
^ "Minority
population growing in the United States, census estimates show".
Los Angeles Times. June 10, 2010.
-
^
"Current Unemployment Rates for States and Historical
Highs/Lows". BLS. 2012-06.
Retrieved 2012-06-15.
-
^
Median Household Income for States: 2007 and 2008, September
2009,
census.gov.
-
^
a
b
Current Population Survey, Bureau of Labor
Statistics, US Government, June 5, 2009,
retrieved June 19, 20099
-
^
Alternative measures of labor underutilization (U6, not
seasonally adjusted), Bureau of Labor Statistics, US
Government, June 5, 2009,
retrieved June 19, 20099
-
^ "Immigrants
top native born in U.S. job hunt".
CNNMoney.com. October 29, 2010.
-
^ "Broader
U-6 Unemployment Rate Increases to 17.1% in April".
The Wall Street Journal. May 7, 2010.
-
^
Four million more people working part time than 2 years ago,
EconPost.com, March 17, 2010,
retrieved March 30, 2010
-
^ "Employment
and Unemployment Among Youth Summary". United States
Department of Labor.
-
^ "Blacks
hit hard by economy's punch". The Washington Post. November
24, 2009.
-
^ "Nearly
half of Detroit's workers are unemployed". The Detroit
News. December 16, 2009.
-
^ Time-Life Books,
Library of Nations: United States, Sixth European English
language printing, 1989
-
^
Benedetti, François (December 17,
2003).
"100 Years Ago, the Dream of Icarus Became Reality".
Fédération Aéronautique Internationale (FAI). Archived from
the original on September 12, 2007.
Retrieved August 15, 2007.
-
^ Shane, Scott "A
General Theory of Entrepreneurship: the Individual-Opportunity
Nexus", Edward Elgar
-
^ Shane, Scott "A
General Theory of Entrepreneurship: the Individual-Opportunity
Nexus", Edward Elgar
-
^ Reynolds, Paul D.
"Entrepreneurship in the United States", Springer, 2007,
ISBN 978-0-387-45667-6
-
^
"Mandelson, Peter. "There is no Google, or Amazon, or Microsoft
or Apple in the UK, Mandelson tells BVCA." BriskFox Financial
News, March 11, 2009". Briskfox.com.
Retrieved April 21, 2012.
-
^
Venture Impact (5 ed.). IHS Global Insight. 2009.
p. 2.
ISBN 0-9785015-7-8.
-
^
Sohl, Jeffrey (March 31, 2010).
"Full Year 2009 Angel Market Trends". University of New
Hampshire Center for Venture Research.
Retrieved September 27, 2011.
-
^
"The United States of Entrepreneurs", The Economist,
March 12, 2009
-
^
"Census Bureau: Two-Year-Average Median Household Income by
State: 2004 to 2007". Census.gov.
Retrieved April 21, 2012.
-
^
US Census Bureau news release in regards to median income,
retrieved August 28, 2007[dead
link]
-
^
US Census Bureau median income per household member,
retrieved August 28, 2008
-
^
Robert E. Rector and Kirk A. Johnson, PhD (January 5, 2004),
Understanding Poverty in America
-
^
Robert
Rector (August 27, 2007),
How Poor Are America's Poor? Examining the "Plague" of
Poverty in America
-
^ W. Michael Cox and
Richard Alm (1999), The myths of rich and poor: why we're better
off than we think. New York: Basic Books
-
^
US Treasury Income Mobility Study,, income data,
retrieved August 29, 2008
-
^
Roger C.
Altman,
The Great Crash, 2008, Foreign Affairs,
retrieved February 27, 2009
-
^ "Americans'
wealth drops $1.3 trillion". CNN. June 11, 2009
-
^ "U.S.
household wealth falls $11.2 trillion in 2008". Reuters.
March 12, 2009.
-
^ "World
Wealth Report 2010."
-
^
Barclays Wealth Insights. Volume 5: Evolving Fortunes.
Barclays (2008). p. 7
-
^
Ody, Elizabeth (March 10, 2011).
"Carlos Slim Tops Forbes List of Billionaires for Second Year".
Bloomberg. Retrieved April
21, 2012.
-
^
Net worth of the United States,
retrieved July 3, 2010
-
^ Saint Louis
Federal Reserve (2012)
"5-Year Treasury Inflation-Indexed Security, Constant Maturity"
FRED Economic Data chart from government debt auctions (the
x-axis at y=0 represents the inflation rate over the life of the
security)
-
^
a
b
Carmen M. Reinhart and M. Belen
Sbrancia (March 2011)
"The Liquidation of Government Debt" National Bureau of
Economic Research working paper No. 16893
-
^ David Wessel
(August 8, 2012)
"When Interest Rates Turn Upside Down" Wall Street
Journal (full
text)
-
^ Lawrence Summers
(June 3, 2012)
"Breaking the negative feedback loop" Reuters
-
^ Matthew Yglesias
(May 30, 2012)
"Why Are We Collecting Taxes?" Slate
-
^ William H. Gross
(May 2, 2011)
"The Caine Mutiny (Part 2)" PIMCO Investment Outlook
-
^ U.S. Treasury
(January 31, 2012)
"Minutes of the Meeting of the Treasury Borrowing Advisory
Committee of the Securities Industry and Financial Markets
Association"
-
^
http://www.bbc.co.uk/news/business-15820601
-
^
http://www.nytimes.com/roomfordebate/2012/02/14/what-went-wrong-in-portugal/private-debt-becomes-public-debt
- ^
a
b
"Manufacturing Output by Country". Greyhill Advisors.
Retrieved October 5, 2011.
-
^
http://www.nasa.gov/worldbook/aviation_worldbook.html[broken
citation]
-
^
Martin Crutsinger (April 20, 2007).
"Factory jobs: 3 million lost since 2000". USA Today.
Associated Press. Retrieved
March 4, 2012.
-
^
Michael Lind (December 1, 2011).
"The Cost of Free Trade". The American Prospect.
Retrieved March 3, 2012.
-
^ "What
Accounts for the Decline in Manufacturing Employment?,
Congressional Budget Office February 18, 2004.
-
^ "Congressional
Record V. 148, Pt. 4, April 11, 2002 to April 24, 2002".
United States Government Printing Office.
-
^
"What Accounts for the Decline in Manufacturing Employment?".
Congressional Budget Office.
Retrieved October 5, 2011.
-
^
Harold Meyerson (November 29,
2011).
"Back from China?". The American Prospect.
Retrieved March 4, 2012.
-
^
Carl Pope (January 18–20, 2012). "America's Dirty War
Against Manufacturing". Bloomberg.
Part 1.
Part 2.
Part 3.
-
^
Dean Baker (January 22, 2012).
"Hasn't Anyone at the NYT Heard of Exchange Rates?". Beat
the Press. Center for Economic and Policy Research.
Retrieved January 22, 2012.
-
^ "The
Food Bubble Economy". The Institute of Science in
Society.
-
^
Apple usurps Google as world's most valuable brand. Reuters.
-
^ Deloitte,
Switching Channels: Global Powers of Retailing 2012,
STORES, January 2012, G20.
-
^
"IHS iSuppli Semiconductor preliminary rankings for 2011".
Retrieved April 21, 2012.
-
^
Barr, Robert.
"China surpasses US as top energy consumer – Business – Oil &
energy – msnbc.com". MSNBC.
Retrieved April 21, 2012.
-
^
World Per Capita Total Primary Energy Consumption,1980–2005
(MS Excel format)
-
^ World Resources
Institute "Energy
Consumption: Consumption per capita" (2001). Nations with
higher per-capita consumption are: Qatar, Iceland, United Arab
Emirates, Bahrain, Luxembourg and Canada. Except for Canada,
these are small countries with a prominent energy-intensive
industry such as oil refining or
steelmaking.
-
^ US Dept. of
Energy, "Annual
Energy Report" (July 2006), Energy Flow diagram
-
^
"Forbes.com". Forbes. November 15, 2005.
Retrieved April 21, 2012.
-
^
Domestic Demand for Refined Petroleum Products by Sector,
U.S.
Bureau of Transportation Statistics,
retrieved December 20, 2007
-
^ "U.S.
Imports of Crude Oil". U.S. Census Bureau.
-
^
Pleven, Liam (November 30, 2011).
"Wall Street Journal". The Wall Street Journal.
Retrieved April 21, 2012.
-
^
Kahn, Chris (December 31, 2011).
"In a firs, gas and other fuels top U.S. exports".
Florida Today (Melbourne, FL): pp. 4A.
-
^
a
b
WFE – YTD Monthly[dead
link]
-
^
"> Data Products > NYSE > Facts & Figures". NYXdata.
Retrieved April 21, 2012.
-
^
"NASDAQ Performance Report", NASDAQ Newsroom (The
Nasdaq Stock Market), January 12, 2007,
retrieved February 15, 2007
-
^
"Trade Statistics". Greyhill Advisors.
Retrieved October 7, 2011.
-
^ "U.S.
trade gap with China cost 2.7 million jobs: study" Yahoo!
News. August 23, 2012.
-
^
"Manufacturing and Trade". Greyhill Advisors.
Retrieved October 7, 2011.
-
^ "US
trade deficit is a significant cause of recession" By Peter
Morici, former Chief Economist at the U.S. International Trade
Commission. February 12, 2009.
-
^
"Record Trade in Services". Economics and Statistics
Administration. Retrieved
October 7, 2011.
-
^ "China
must keep buying US Treasuries for now-paper". Reuters.
August 19, 2009.
-
^
"IMF: US accounts for one-third of annual remittances to
Developing Countries of $100bn". Finfacts.com.
Retrieved April 21, 2012.
-
^
"The Implementation of Monetary Policy – The Federal Reserve in
the International Sphere" (PDF).
Retrieved April 21, 2012.
-
^ Benjamin J. Cohen,
The Future of Money, Princeton University Press, 2006,
ISBN 0-691-11666-0; cf. "the dollar is the de facto
currency in Cambodia", Charles Agar, Frommer's Vietnam,
2006,
ISBN 0-471-79816-9, p. 17
-
^ "Biggest
game in town". BBC News. January 29, 2009.
-
^
"Currency Composition of Official Foreign Exchange Reserves
(COFER) – June 30, 2011" (PDF).
Retrieved April 21, 2012.
-
^
Rooney, Ben (February 10, 2011).
"IMF calls for dollar alternative". CNN.
Retrieved March 28, 2012.
-
^
a
b
c
d
e
f
Regulation and Control in the U.S.
Economy: About.com
-
^
"U.S. Federal Individual Income Tax Rates History, 1913-2011".
Tax Foundation. 9 September 2011.
-
^
http://www.cbpp.org/cms/index.cfm?fa=view&id=3411
-
^
a
b
c
d
"Bush's Regulatory Kiss-Off – Obama's assertions to the
contrary, the 43rd president was the biggest regulator since
Nixon.". Reason magazine. January 2009.
-
^
Index of Economic Freedom: United States, Index of
Economic Freedom
-
^
"Is the US Really a Nation of God-Fearing Darwin-Haters?".
Der Spiegel. June 6, 2009.
-
^
Frum, David (2000), How We Got Here: The '70s, New
York City: Basic Books, p. 72,
ISBN 0-465-04195-7
-
^
U.S. Budget 2001
-
^
/ U.S. Treasury
-
^
MSNBC[dead
link]
-
^
Bloomberg[dead
link]
-
^
"Washington Post 29 December 2005", The Washington Post[dead
link]
-
^
Zeng, Min (October
6, 2008),
"Bailout Funding Promises To Pressure Treasury Prices",
The Wall Street Journal,
retrieved November 17, 2008
-
^ "S&P
warns may cut Japan's rating over soaring debt". Reuters.
January 26, 2010.
-
^
Kumar, Vishesh.
"Is Rising U.S. Debt Inviting Trouble? Ask Japan". Daily
Finance. Retrieved May 18,
2010.
External links

|
|
|
1)
scrivi
le parole inglesi dentro la
striscia gialla
2)
seleziona il testo
3)
clicca "Ascolta il testo"
DA INGLESE A ITALIANO
Inserire
nella casella Traduci la parola
INGLESE e cliccare
Go.
DA ITALIANO A INGLESE
Impostare INGLESE anziché italiano e
ripetere la procedura descritta.
|
|